← Projects2 min read
One Dashboard for Three Ticket Queues
A custom IT dashboard that pulls our ticketing system, our MSP portal and Microsoft Teams into one view, with the duplicates filtered out.
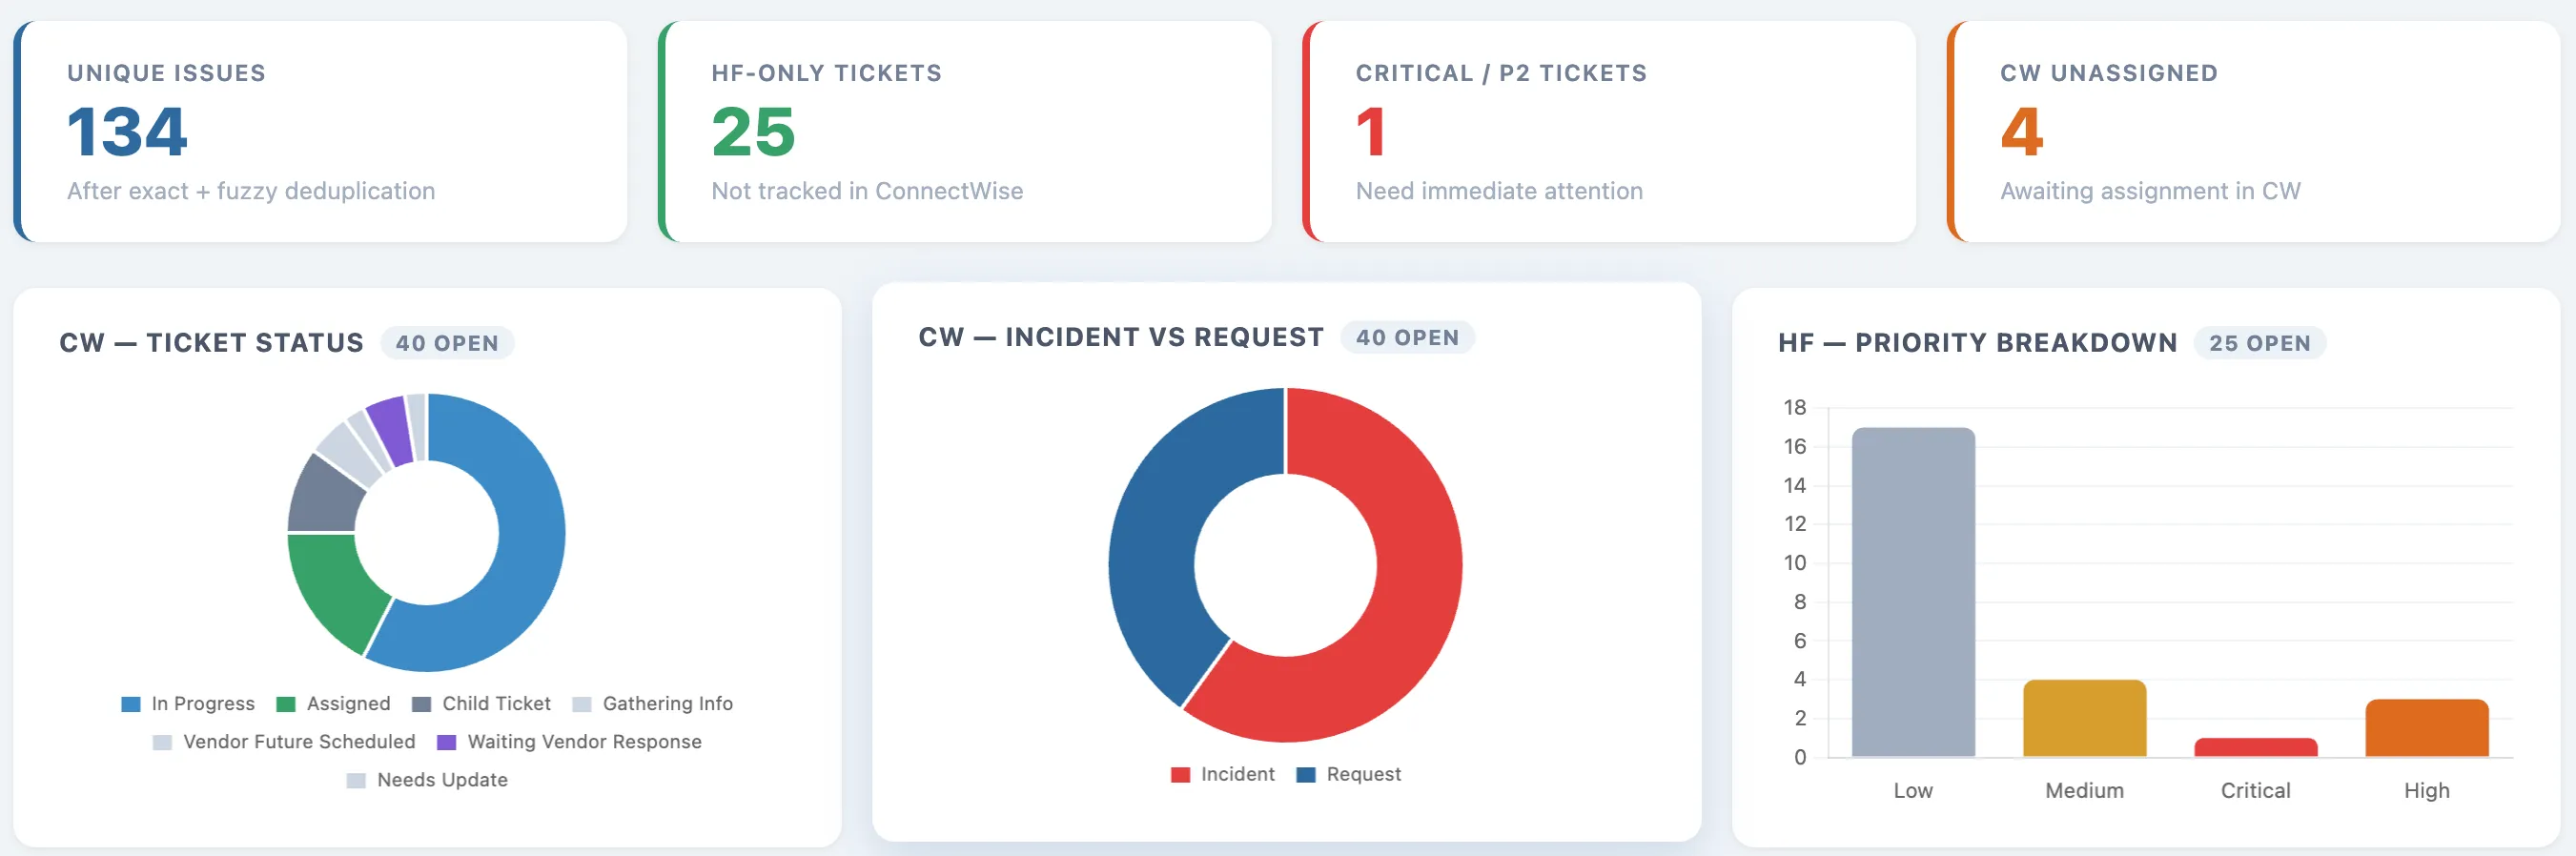
What it is
A dashboard for my IT team that takes three separate streams of support requests and turns them into one list I can actually act on. I built it in about a week with Claude Code.
The problem
Support requests come at us from three places: our internal ticketing system, our MSP’s portal, and a Microsoft Teams thread where the urgent stuff shows up. Before I could do anything useful on a Monday, I had to read all three and stitch them together in my head. And the same printer problem would be logged four different ways.
How it works
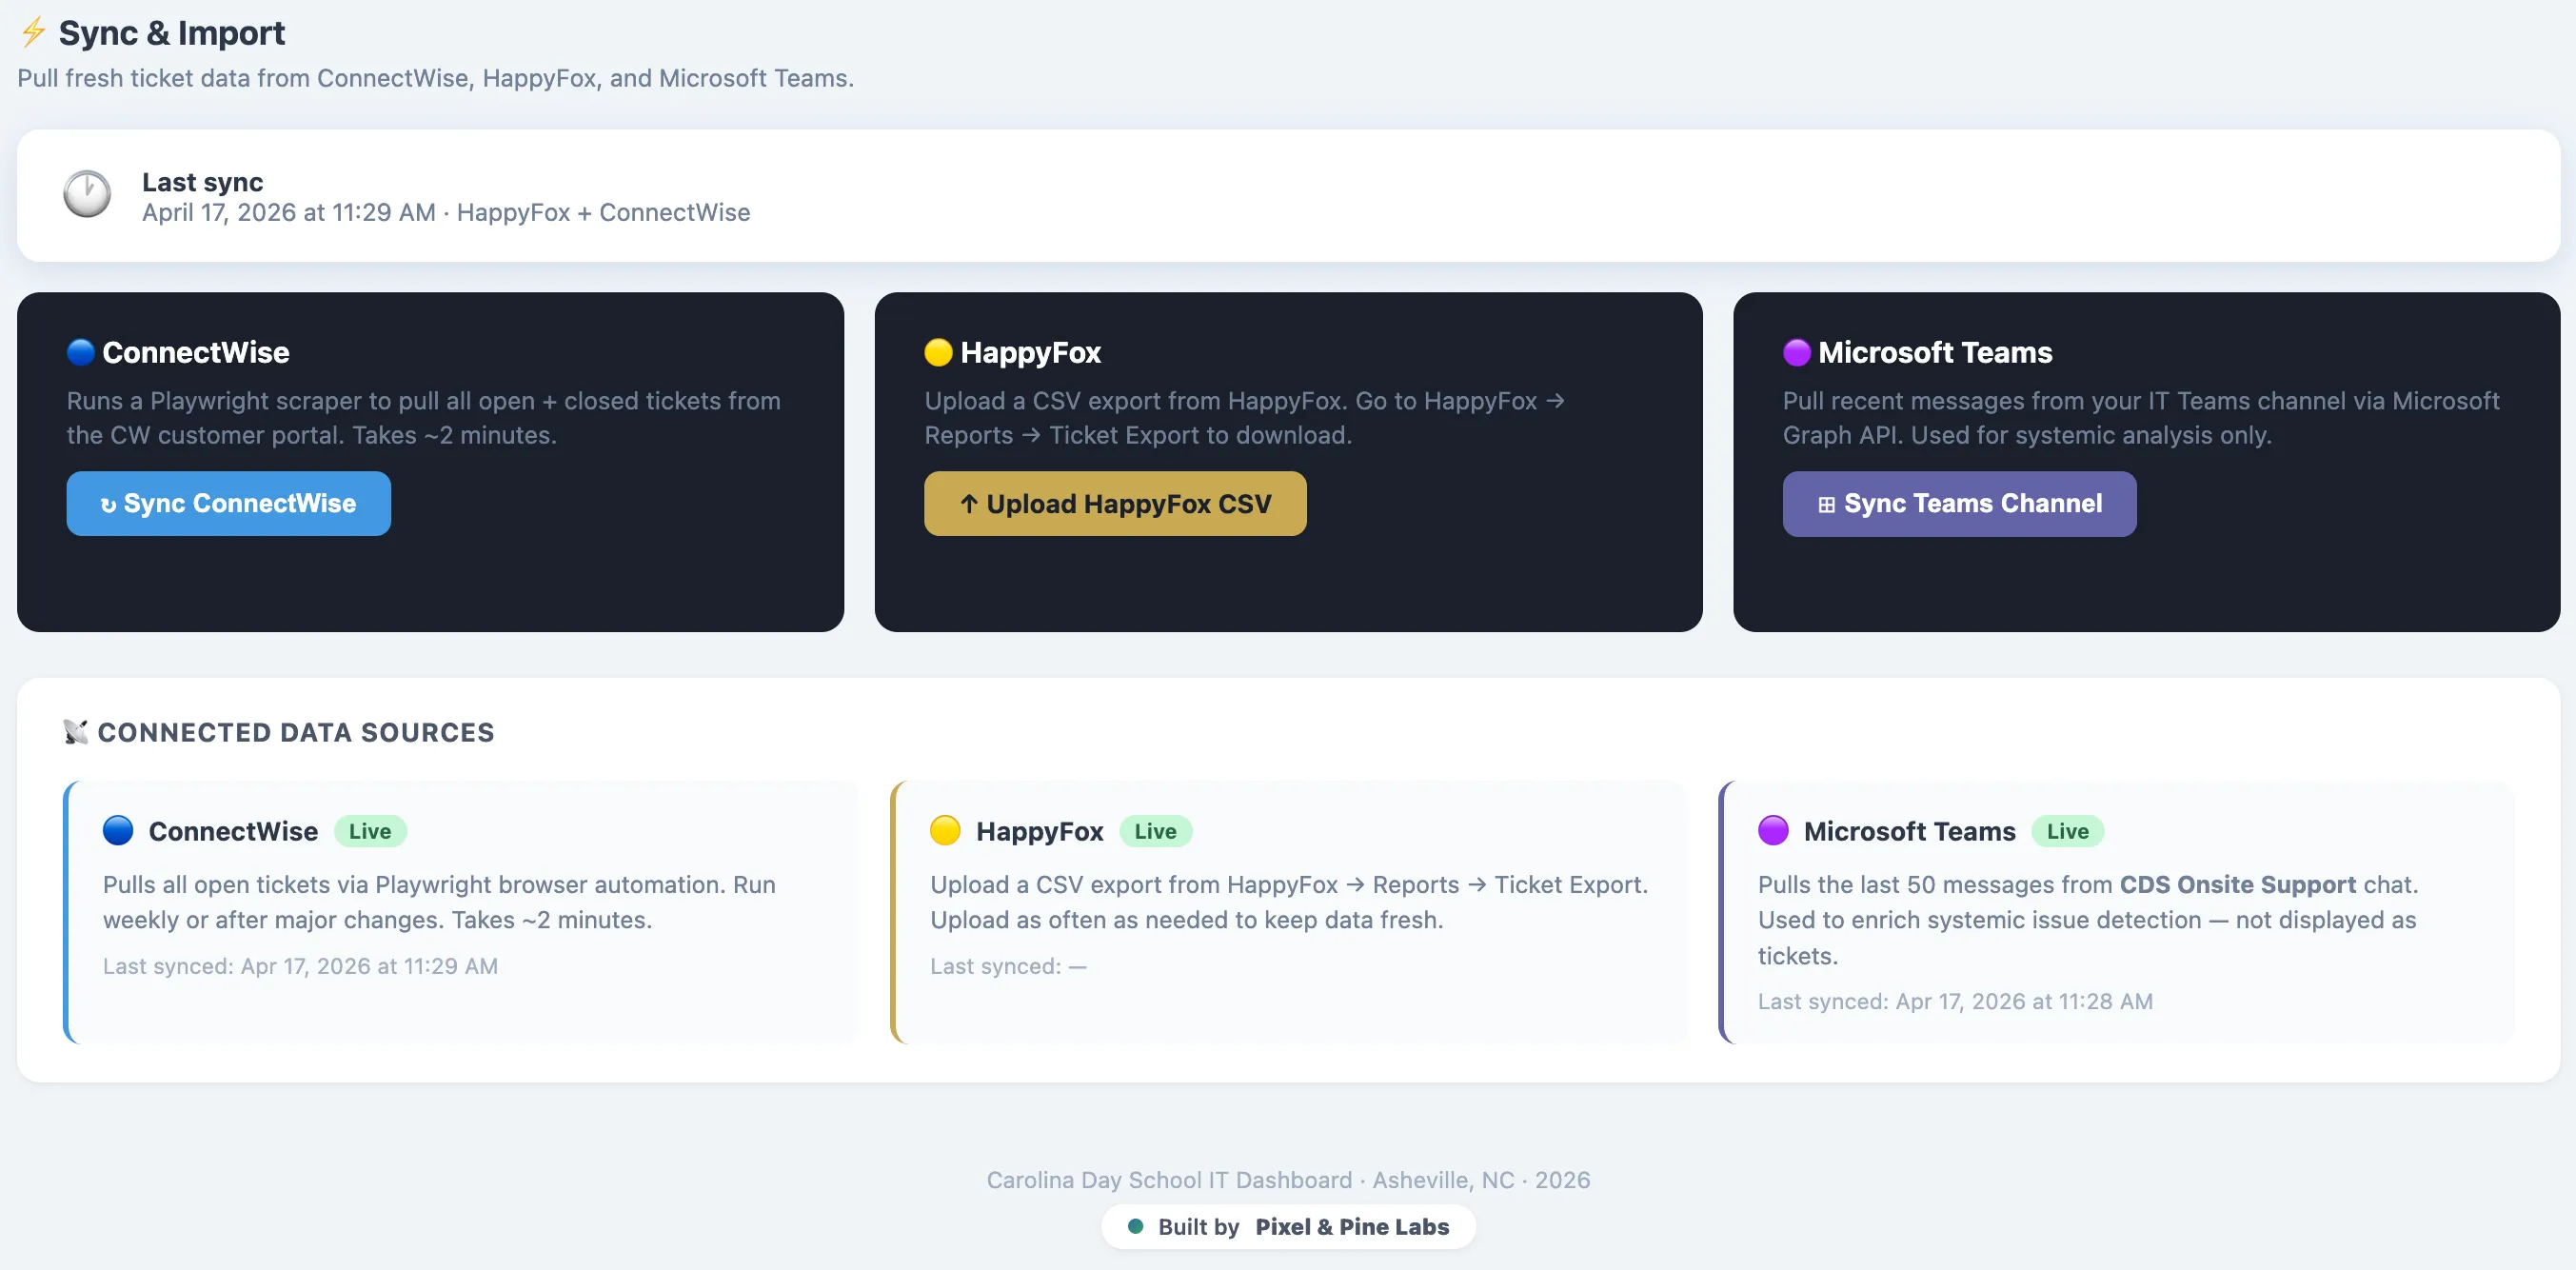
- Teams: pulled through the Microsoft Graph API.
- Internal tickets: read from CSV exports of our ticketing system.
- MSP portal: scraped from ConnectWise using secure credentials.
- Deduplication: a fuzzy-matching step compares tickets across all three sources, so one issue counts once.
- Categories: every unique ticket gets sorted into a theme, like infrastructure, user education or vendor reliability.
- Next step: each ticket gets a recommended starting action, which helps when a technician hits a kind of issue they haven’t seen before.
It’s three pages. That’s it.
What’s on it now
It has grown since that first week. The main page now has:
- Needs Attention: the tickets that can’t wait.
- Duplicate Group Analysis: which tickets got matched up, so I can check the matching.
- Systemic Issues: category clusters, issues open 30 days or more, and people with two or more tickets, which usually points to a training opportunity.
- At a glance charts, each answering one question: Are we keeping up? Where are tickets sitting? Who is carrying the load? How old is the backlog?
- A ticket explorer for digging into the full list.
The whole thing sits behind a password, since it’s our real ticket data.
What I like about it
It runs on its own. There’s no subscription and no monthly AI fee, and I don’t have to prompt anything. I used AI to build the tool, and now the tool does the work every week without it.
What was hard
This was not one prompt. It was a week of feeding Claude error logs, figuring out why an API call failed, and pushing back when the output didn’t match what the data needed. I had to think like an engineer the whole time.
What changed
Mondays start with a sync and not a scramble. Quarterly reviews use trend data, not whatever I happen to remember. And when the same infrastructure issue shows up week after week, the budget conversation gets a lot easier.
Read more
I wrote about why I built this, and what it changed about how I lead, in I Was Drowning in Data. So I Built My Way Out.
Keep coding!
Ryan